LemonTrades
TL;DR
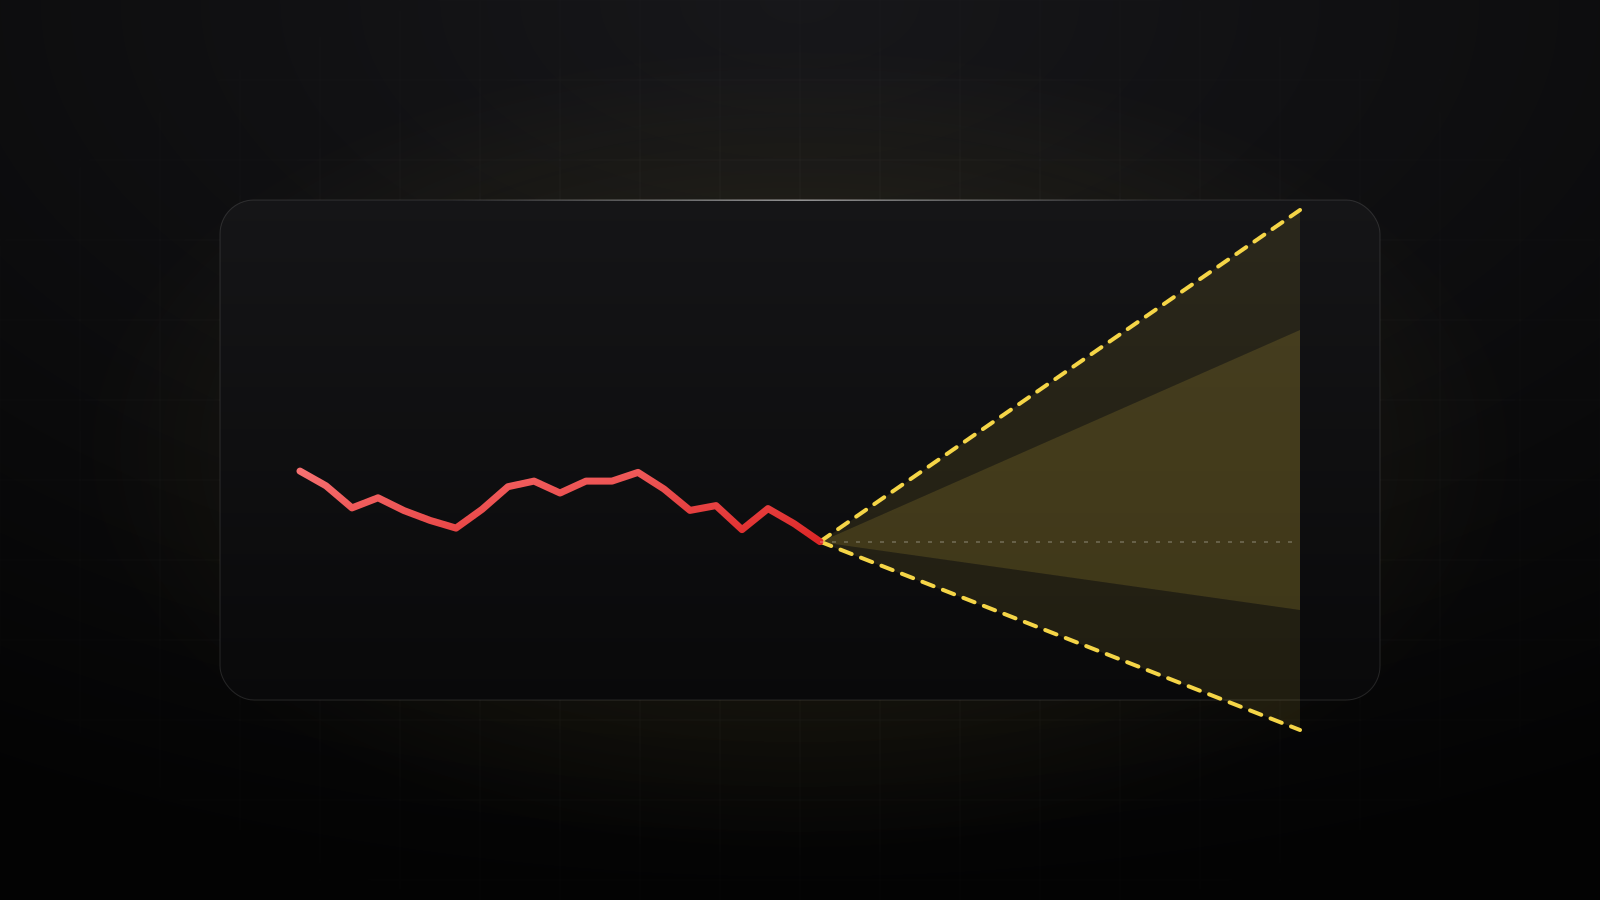
- Implied volatility (IV) is the size of move that Tesla options are priced for, as a yearly percentage. Tesla’s is often 40% to 70%, two to three times the S&P 500’s.
- The expected move is roughly price × IV × √(days ÷ 365). The calculator below works it out at today’s price.
- IV rises into earnings and collapses after (“IV crush”), which can sink option buyers even when they get the direction right.
- When TSLA moves more than its options expected, LemonTrades tells you why within minutes.
Every Tesla option has a price, and that price contains a forecast: how much the market thinks Tesla will move before the option expires. That forecast is implied volatility, and it’s the most useful number on an options screen.
What implied volatility is
Options get more expensive when big moves are more likely. Work backward from an option’s price and you get the volatility the market is pricing in: its implied volatility, written as a yearly percentage. A TSLA IV of 50% means the market expects Tesla to move about 50% over a year, up or down, which is about 3.2% on a typical day (50% ÷ √252).
Implied vs realized volatility
Realized volatility is how much Tesla actually moved. Our live TSLA technical analysis page shows its 30-day and one-year figures. When IV is well above realized, options are pricing in more movement than Tesla has been delivering, usually because something is coming, like earnings. When IV is below realized, options are cheap relative to recent moves.
Earnings and the IV crush
In the days before Tesla reports, IV on short-dated options climbs, because a big move is likely: over its last eight reports Tesla moved about 8% on average the next day, and more than 20% once. After the results come out, the uncertainty is gone and IV collapses, often within minutes of the next open. An option bought before earnings can lose value even if Tesla moves your way, because the drop in IV outweighs the move. A common shortcut for the move priced in around earnings is the price of the at-the-money straddle (a call plus a put at the same strike). See how Tesla actually reacted on TSLA stock earnings.
Is Tesla’s IV high or low right now?
Raw IV says little without context, so traders compare it with its own past. IV rank puts today’s IV on a scale of 0 to 100 between its one-year low and high; IV percentile is the share of days in the past year with lower IV. A rank near 100 means options are expensive by Tesla’s own standards. Most broker platforms show both.
How traders use it
- To size trades: the expected move tells you how far Tesla might go, so you can set stops outside normal noise.
- To choose a strategy: when IV is high, option sellers collect more premium; when it’s low, buying options is cheaper.
- To read the mood: IV jumps when markets are scared, and on Tesla-specific news.
Know the risks
Options can expire worthless, and selling them can lose far more than the premium you collect. IV is a market price, not a promise: Tesla often moves more, or less, than its options expect. Leveraged funds like TSLL are hit by volatility too, in a different way: the daily reset makes them drift below 2× Tesla when it swings.
Education, not financial advice. Options are complex and risky; read your broker’s options disclosure first. See our disclaimer.