LemonTrades
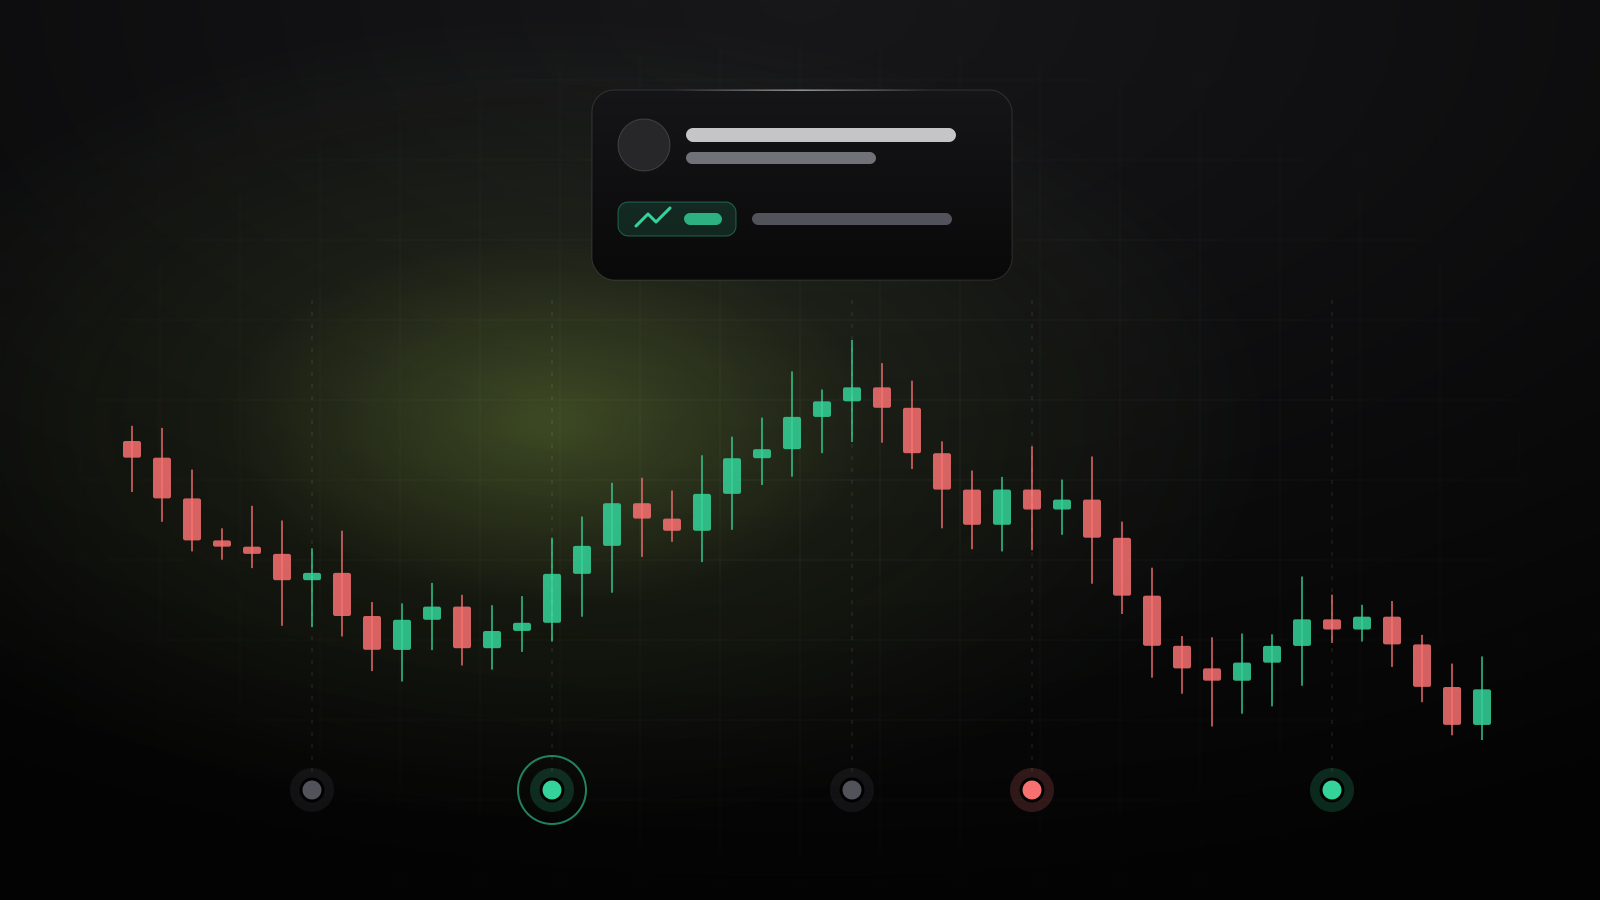
A stock graph is a picture of every price a stock traded at over time. Once you know the five or six things on it, you can read any chart in seconds: a stock, gold, oil or a currency.
1. Start with the axes
Time runs along the bottom, from left (older) to right (now). Price runs up the right-hand side. So a line going up and to the right means the price rose over that time. Always check two things first:
- The time frame. One day, one month, five years? The same stock can be up on the day and down on the year.
- The price scale. A chart that starts at $100 rather than $0 makes small moves look huge. Read the numbers, not just the shape.
2. Line, bar or candlestick
- Line charts join up the closing price of each day (or minute, or week). Simple and good for the big picture.
- Candlestick charts show four prices for each period: where it opened, its high, its low, and where it closed. Most traders use them.
- Bar charts show the same four prices as candlesticks, drawn as a line with small ticks.
3. How to read a candlestick
The thick part is the body: from the open to the close. The thin lines, called wicks or shadows, reach to the highest and lowest prices of the period. A long wick means the price went there but got pushed back. A long body with short wicks means one side, buyers or sellers, was in control the whole time.
4. Volume: how much traded
The bars along the bottom show volume, how many shares changed hands in each period. Volume tells you how much conviction is behind a move. A big rise on heavy volume means a lot of buyers agree; the same rise on thin volume is easier to undo.
5. Trends, support and resistance
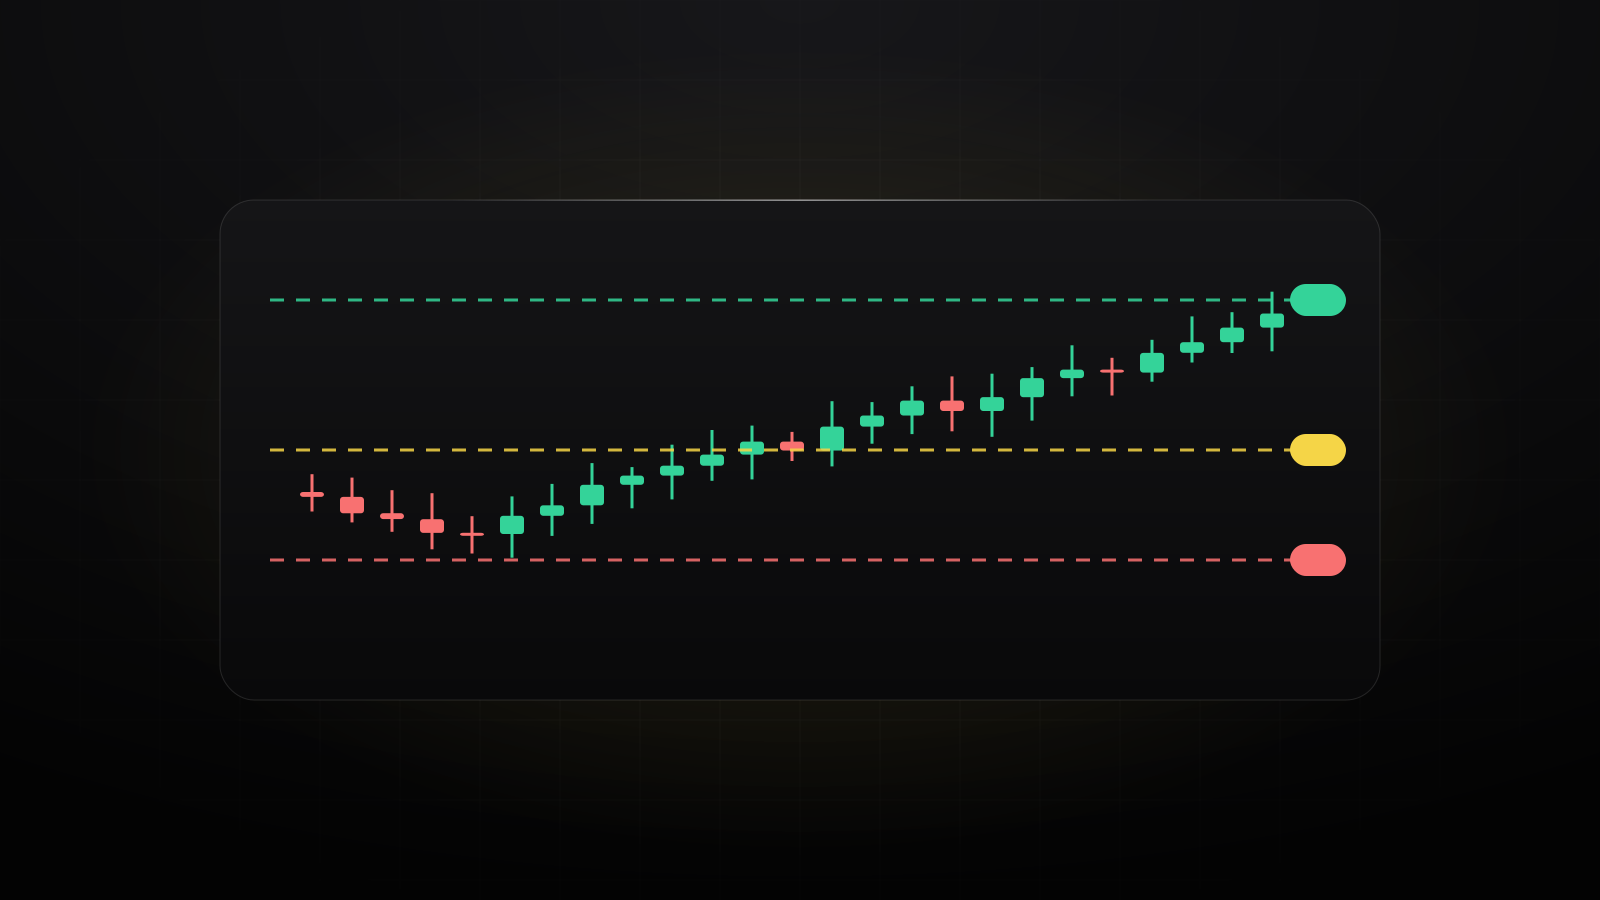
- Trend: higher highs and higher lows is an uptrend; lower highs and lower lows is a downtrend. Sideways means neither side is winning.
- Support is a price where the stock has stopped falling before, because buyers stepped in.
- Resistance is a price where it has stopped rising before, because sellers stepped in.
- A breakout is when the price pushes through one of these levels, often on heavy volume. Old resistance often becomes new support.
6. Moving averages
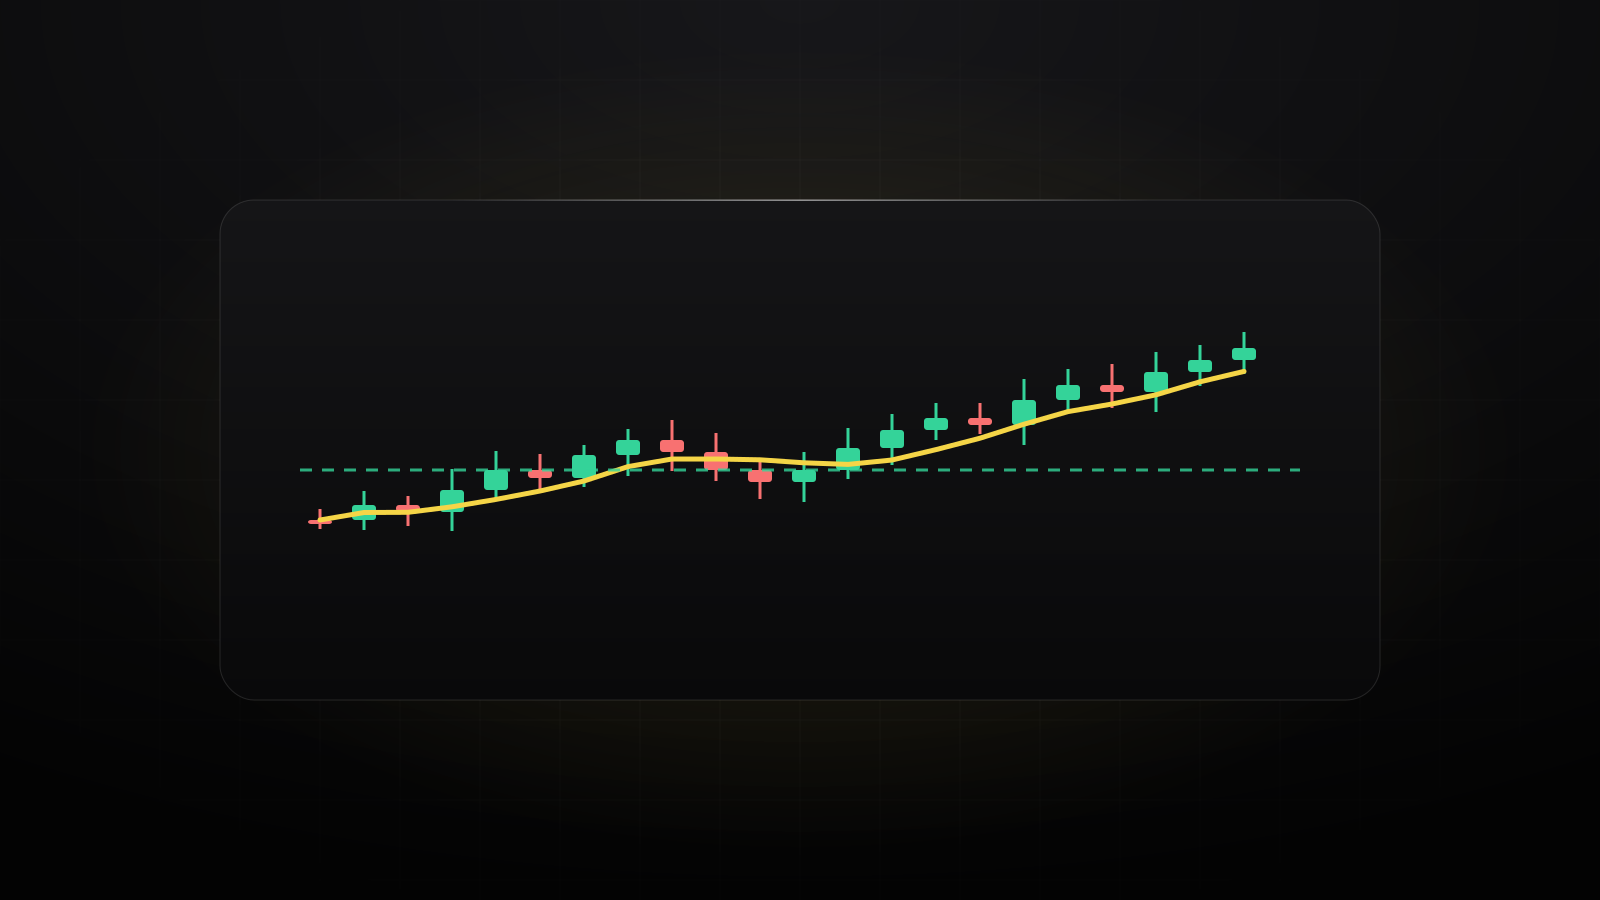
A moving average is the average closing price over the last so many periods, drawn as a smooth line. It filters out the noise. The 50-day and 200-day averages are the most watched: a price above its 200-day average is usually called a long-term uptrend, and when the 50-day crosses above the 200-day, traders call it a “golden cross”.
7. Ask what moved it
Every big candle has a reason: earnings, a data release, a headline. A chart shows what happened; the news tells you why, and whether it’s likely to last. That’s why LemonTrades puts the news right on its charts: each alert and big headline is a dot on the price, colored by what the market did next.
Common mistakes
- Judging a move without checking the time frame or the price scale.
- Reading percentages as dollars, or the other way around. A $5 move is big for a $20 stock and small for a $500 one.
- Seeing patterns in a few candles. Levels matter more when the price has reacted to them several times.
- Forgetting the market. If the whole market fell 3%, a stock down 3% didn’t do anything unusual.
Want to practice? Try reading the chart and placing trades with virtual money in our free trade simulator.
Education, not financial advice. Charts show what happened, not what will happen. See our disclaimer.