LemonTrades
TL;DR
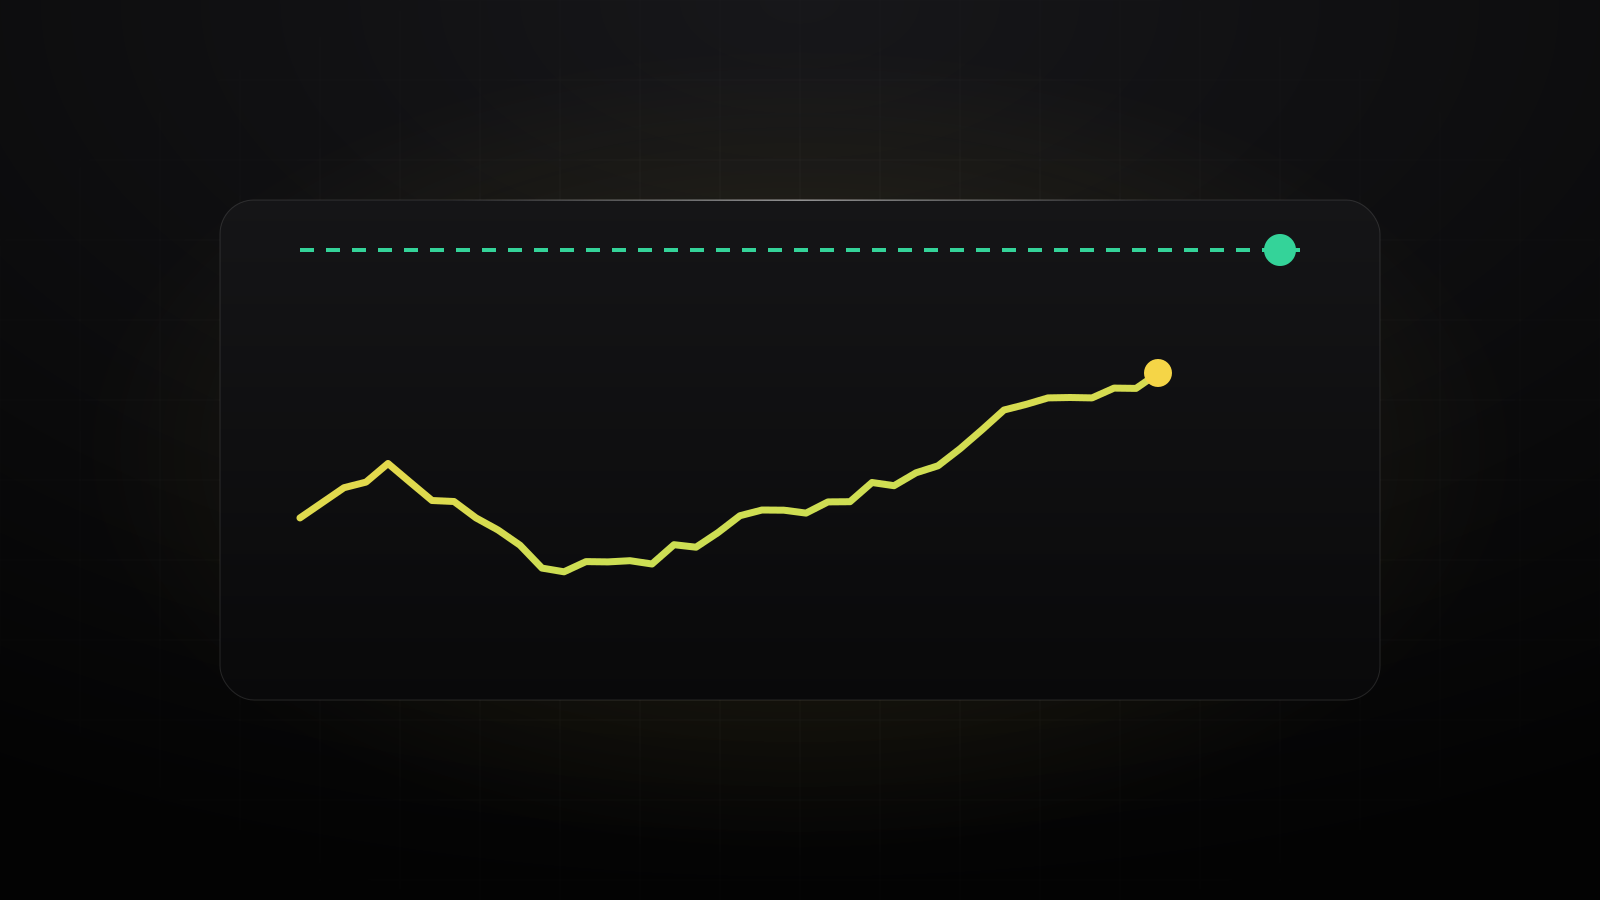
- With about two months left, Goldman Sachs and JPMorgan both see the S&P 500 ending 2026 at 8,000, a few percent above where it trades now.
- The index started the year at 6,846, fell to 6,344 in March as oil spiked, and set a record of 7,819 on October 6.
- The risks for the last stretch: a Fed that raised rates in September, a 10-year yield above 5%, oil near $100 and doubts about AI spending.
- LemonTrades tells you what moved the S&P 500, and why, as it happens, and warns you before the data that moves it.
At the start of every year, strategists publish where they think the S&P 500 will end it. By October, most of the year has happened, so the question is simpler: can the rally hold, and how far is left to the targets?
The year so far
- Start: 6,846 at the end of 2025.
- March: a slide to 6,344 on March 30 as the war with Iran sent oil above $100.
- Summer: a rebound on strong earnings and AI spending, even as the Fed turned toward hikes.
- October: a record close of 7,819 on October 6, then a sell-off in chip stocks.
What could carry it to 8,000
- Earnings: JPMorgan raised its estimate for 2026 S&P 500 earnings to $365 a share; strong third-quarter reports, now under way, would support it. See this week’s earnings calendar.
- AI spending: the biggest companies are still raising their data center budgets, which feeds chipmakers and cloud providers.
- Seasonality: November and December have historically been among the strongest months, and the S&P 500 has tended to do well after midterm elections, like the one on November 3, 2026.
What could stop it
- The Fed: it raised rates in September and most officials expected one more hike in 2026. The next decision is on October 28: see when is the next Fed meeting.
- Yields: the 10-year Treasury yield above 5% makes bonds a real alternative to stocks.
- Oil: near $100 a barrel on attacks in the Strait of Hormuz, which keeps inflation up. See the oil price.
- Valuations: the Buffett indicator is far above its long-run average, so there’s little room for disappointment.
- AI doubts: the October chip sell-off showed how fast the market’s biggest trade can turn. See why Nvidia plunges.
How much to trust a year-end target
Year-end targets are educated guesses, and strategists have often missed by a wide margin, in both directions. They also tend to follow the market: when stocks rise, targets rise. Use them for the reasoning behind them, not as a forecast to trade on. Day to day, what moves the index is news: see why the stock market is moving today.
How to own the S&P 500
The simplest way is a low-cost index fund or ETF, like the Vanguard S&P 500 ETF (VOO); traders use S&P 500 futures, which trade almost around the clock. See the best futures to trade.
Sources
- The Motley Fool: Goldman Sachs keeps its 8,000 target
- Reuters via Yahoo Finance: J.P. Morgan lifts its target to 8,000
- Invezz via TradingView: 2026 S&P 500 forecasts
Education, not financial advice. Market predictions are often wrong. See our disclaimer.