LemonTrades
Once a month, at 8:30 in the morning New York time, the US publishes its inflation report. For a few minutes it’s the most important number in the world for traders. Here’s what it is and how to read it.
What CPI stands for
CPI stands for Consumer Price Index. It tracks what a basket of everyday goods and services costs: rent, groceries, gas, cars, insurance, haircuts. In the US it’s published by the Bureau of Labor Statistics (BLS) every month, usually in the second week, for the month before.
Housing is the biggest piece, about a third of the index, which is why rents matter so much to the number.
Is CPI the same as inflation?
Not quite. CPI is a price level: an index number, like 310. Inflation is how fast that level is rising, as a percentage. When the news says “inflation is 3%”, it means CPI is 3% higher than a year ago.
CPI is also only one measure of inflation. The Fed’s 2% target is based on a different one, the PCE price index, which comes out later in the month. Markets watch both, but CPI comes first, so it usually moves markets more.
How to calculate the inflation rate from CPI
Take the change in the index, divide it by the old value, and multiply by 100:
Inflation rate = (CPI now − CPI a year ago) ÷ CPI a year ago × 100
For example, if the index was 300.0 a year ago and is 309.0 now: (309.0 − 300.0) ÷ 300.0 × 100 = 3.0%. Use last month’s index instead of last year’s and you get the monthly change. (The official monthly number is seasonally adjusted, so your answer can differ slightly from the one in the report.)
The numbers traders actually watch
The report comes with several figures. Four matter most:
- Headline CPI m/m: the change from last month, for everything.
- Core CPI m/m: the same, without food and energy, which jump around. This is usually the one that moves markets most.
- Headline and core CPI y/y: the change from a year ago, the “inflation rate” you see in the news.
- The details: shelter (rents), and services without housing, which the Fed watches closely.
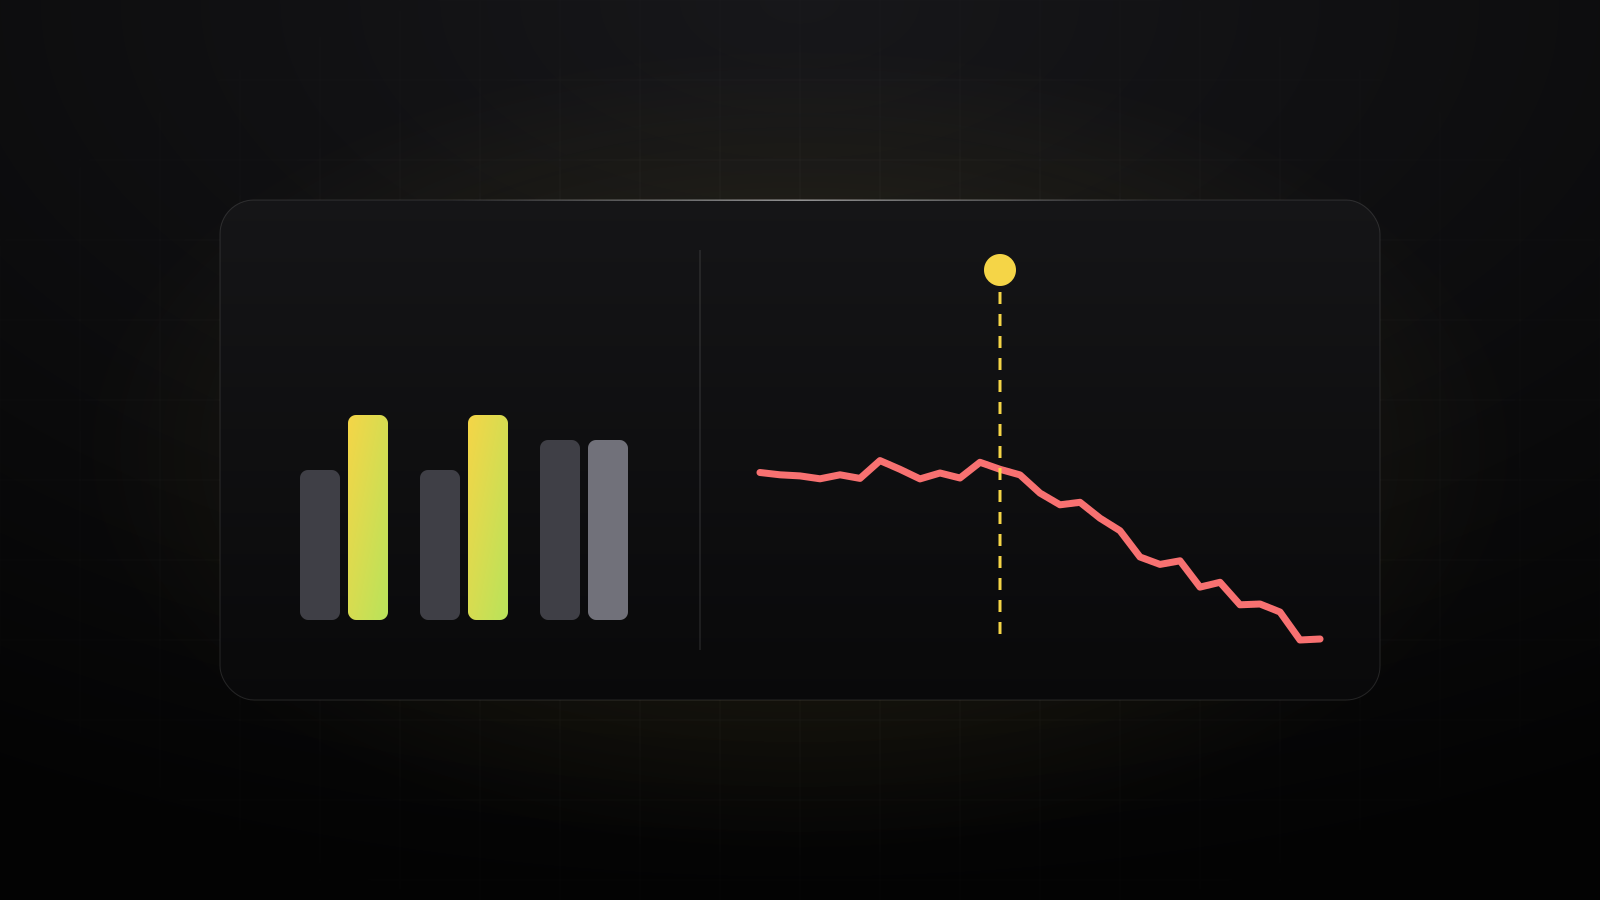
What moves markets isn’t the number itself, but the surprise: the actual figure against the forecast. A core reading of 0.4% when 0.3% was expected is a big miss, even though the difference looks tiny.
How CPI moves markets
Inflation decides what the Fed does with interest rates, so every CPI report changes the odds of the next rate cut or hike. Prices move on that change:
- Hotter than expected: rate cuts look further away. Treasury yields and the dollar usually rise, gold usually falls, and stocks often drop, tech most of all.
- Cooler than expected: the reverse. Yields and the dollar fall, gold and stocks usually rise.
- In line: often a smaller move, with direction coming from the details, like core against headline, or rents.
“Usually” matters here. If inflation is hot mainly because of oil, gold can hold up better than you’d expect. And the first move after the release sometimes reverses within minutes, once traders read past the headline number.
Trading around CPI
In the first minutes after 8:30, spreads widen and prices can jump past stop orders. Traders usually step aside before the release, hold through it only with a small position, or wait for the first 15 minutes to settle and trade the reaction. We cover all three in How to trade gold.
The BLS publishes its release dates for the whole year in advance. You’ll find the next one on this week’s economic calendar.
Education, not financial advice. Trading around big releases is risky and you can lose money quickly. See our disclaimer.